Rather than dwell on the horrifying outcome of the American election, let’s continue our exploration of the EDGAR data.
Let’s examine the sheets available.
<- readxl:: excel_sheets ("../data-stories-climate-change/data/edgar-co2-2024.xlsx" )
[1] "info"                            "citations and references"
[3] "fossil_CO2_totals_by_country"    "fossil_CO2_by_sector_country_su"
[5] "fossil_CO2_per_GDP_by_country"   "LULUCF_macroregions"
[7] "fossil_CO2_per_capita_by_countr"
To examine CO2 emissions per GDP by country, we download the fifth sheet.
<- readxl:: read_excel ("../data-stories-climate-change/data/edgar-co2-2024.xlsx" , sheet = sheets_avail[5 ])str (CO2_per_GDP)
tibble [212 × 37] (S3: tbl_df/tbl/data.frame)
 $ Substance         : chr [1:212] "CO2" "CO2" "CO2" "CO2" ...
 $ EDGAR Country Code: chr [1:212] "ABW" "AFG" "AGO" "AIA" ...
 $ Country           : chr [1:212] "Aruba" "Afghanistan" "Angola" "Anguilla" ...
 $ 1990              : num [1:212] 0.0925 0.0548 0.1307 0.0224 0.376 ...
 $ 1991              : num [1:212] 0.0965 0.0599 0.1357 0.0362 0.3441 ...
 $ 1992              : num [1:212] 0.1009 0.0377 0.1483 0.0285 0.2001 ...
 $ 1993              : num [1:212] 0.0944 0.0493 0.1954 0.0346 0.1718 ...
 $ 1994              : num [1:212] 0.0991 0.0598 0.1825 0.0445 0.1673 ...
 $ 1995              : num [1:212] 0.1063 0.0346 0.1789 0.0553 0.1303 ...
 $ 1996              : num [1:212] 0.0691 0.0354 0.1907 0.0568 0.1186 ...
 $ 1997              : num [1:212] 0.107 0.0365 0.186 0.0478 0.1024 ...
 $ 1998              : num [1:212] 0.1075 0.0392 0.1845 0.0381 0.114 ...
 $ 1999              : num [1:212] 0.1075 0.0399 0.1911 0.0331 0.1628 ...
 $ 2000              : num [1:212] 0.0755 0.0312 0.1698 0.0461 0.1594 ...
 $ 2001              : num [1:212] 0.0732 0.032 0.1598 0.0476 0.1566 ...
 $ 2002              : num [1:212] 0.0808 0.0248 0.1382 0.0366 0.1745 ...
 $ 2003              : num [1:212] 0.0921 0.0244 0.1461 0.0401 0.1738 ...
 $ 2004              : num [1:212] 0.0876 0.0213 0.1344 0.0338 0.1727 ...
 $ 2005              : num [1:212] 0.097 0.0272 0.1033 0.0284 0.1538 ...
 $ 2006              : num [1:212] 0.1056 0.0287 0.0967 0.0252 0.1447 ...
 $ 2007              : num [1:212] 0.1106 0.036 0.0886 0.0205 0.1402 ...
 $ 2008              : num [1:212] 0.1078 0.0661 0.0893 0.0252 0.1289 ...
 $ 2009              : num [1:212] 0.1324 0.0863 0.0977 0.0465 0.1271 ...
 $ 2010              : num [1:212] 0.1332 0.0967 0.1009 0.0571 0.1306 ...
 $ 2011              : num [1:212] 0.0776 0.141 0.1014 0.0619 0.1394 ...
 $ 2012              : num [1:212] 0.1013 0.1071 0.0977 0.067 0.1249 ...
 $ 2013              : num [1:212] 0.1046 0.0862 0.1074 0.0836 0.1301 ...
 $ 2014              : num [1:212] 0.1136 0.0791 0.1109 0.0879 0.1366 ...
 $ 2015              : num [1:212] 0.1199 0.0831 0.1178 0.1019 0.1276 ...
 $ 2016              : num [1:212] 0.1237 0.0733 0.1143 0.1141 0.115 ...
 $ 2017              : num [1:212] 0.1112 0.0765 0.1022 0.1349 0.1306 ...
 $ 2018              : num [1:212] 0.1084 0.0744 0.0973 0.1705 0.1248 ...
 $ 2019              : num [1:212] 0.1329 0.0654 0.1029 0.111 0.1141 ...
 $ 2020              : num [1:212] 0.1418 0.0652 0.0819 0.0979 0.1086 ...
 $ 2021              : num [1:212] 0.1229 0.0925 0.0988 0.0895 0.1102 ...
 $ 2022              : num [1:212] 0.1117 0.1027 0.1038 0.0783 0.0961 ...
 $ 2023              : num [1:212] 0.1119 0.1133 0.1062 0.0727 0.0926 ...
We need to make this longer if we want to use Tidyverse-style plotting commands.
<- CO2_per_GDP |> :: pivot_longer (cols = (starts_with ("19" ) | starts_with ("20" )),names_to = "year" ,values_to = "emissionsPerGDP" |> # Make the year a properly formatted YYYY-MM-DD string for parsing :: mutate (year = lubridate:: as_date (paste0 (year, "-12-31" )))
Now we can make our first attempt at a plot.
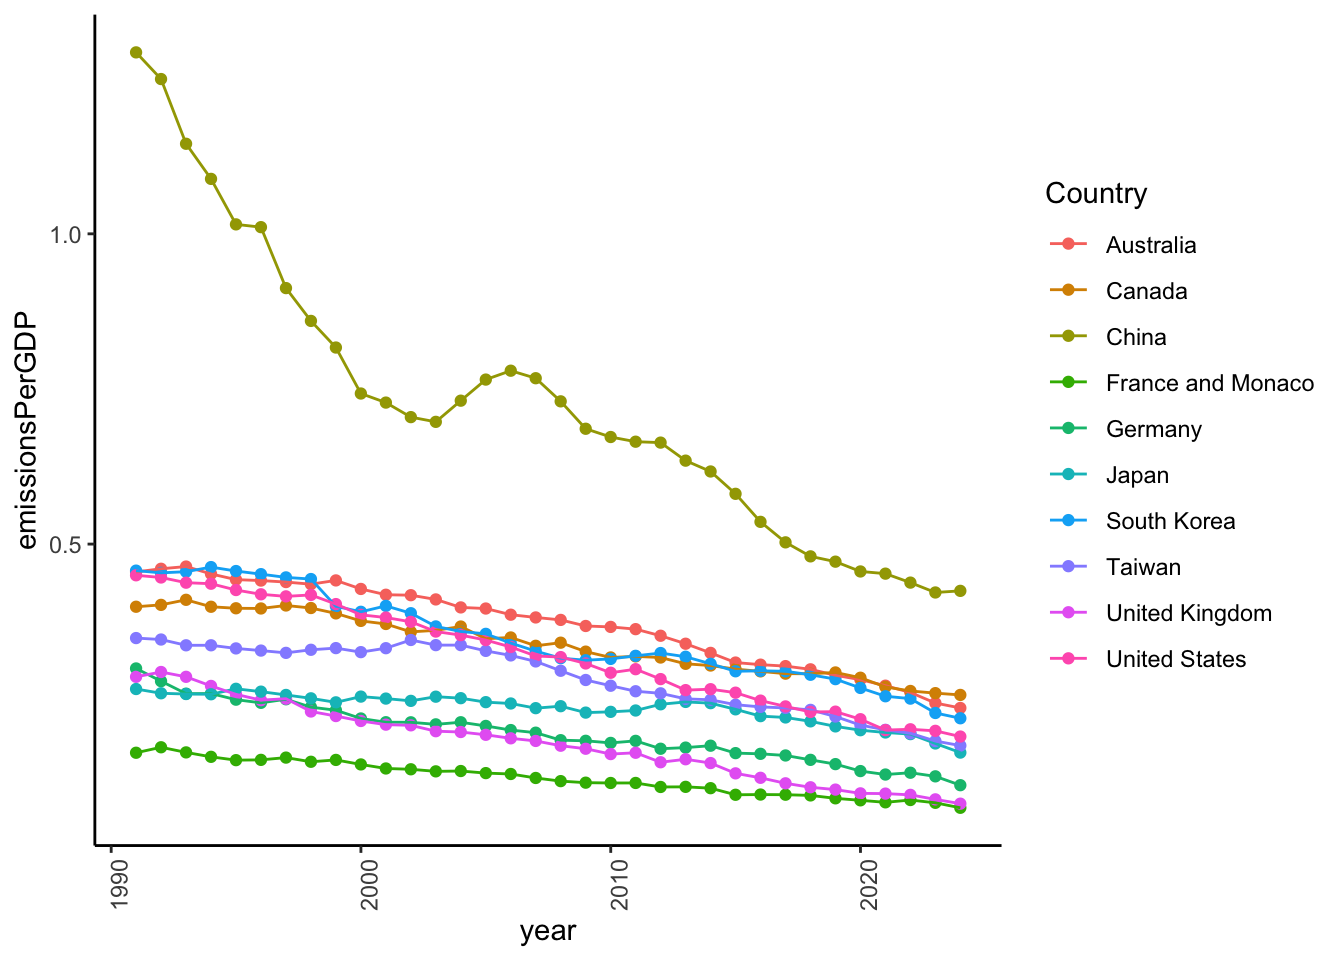
library (ggplot2)|> :: filter (%in% c ("United States" ,"China" ,"Japan" ,"Germany" ,"France and Monaco" ,"Canada" ,"United Kingdom" ,"Taiwan" ,"South Korea" ,"Australia" |> :: ggplot () + aes (year, emissionsPerGDP, color = Country, group = Country) + geom_point () + geom_line () + theme_classic () + theme (axis.text.x = element_text (angle = 90 ))
Let’s look at the top countries in 2023.
<- CO2_per_GDP_long |> :: filter (year == "2023-12-31" ) |> :: arrange (desc (emissionsPerGDP))<- top_2023[1 : 20 ,]<- top_20_2023$ Country|> :: select (Country, emissionsPerGDP) |> :: kable (format = 'html' ) |> :: kable_classic ()
Palau
5.0566092
Trinidad and Tobago
0.6230627
New Caledonia
0.6168736
Turkmenistan
0.5836374
North Korea
0.5497635
Iran
0.5406488
Curaçao
0.5196791
Kuwait
0.5096025
Libya
0.5023209
Oman
0.5006138
Mongolia
0.4997327
Gibraltar
0.4975533
South Africa
0.4604654
Bahrain
0.4377696
Uzbekistan
0.4320528
China
0.4246254
Qatar
0.4129737
Syria
0.4118205
Laos
0.4054825
Russia
0.3558355
Let’s see how these countries fared since 1990.
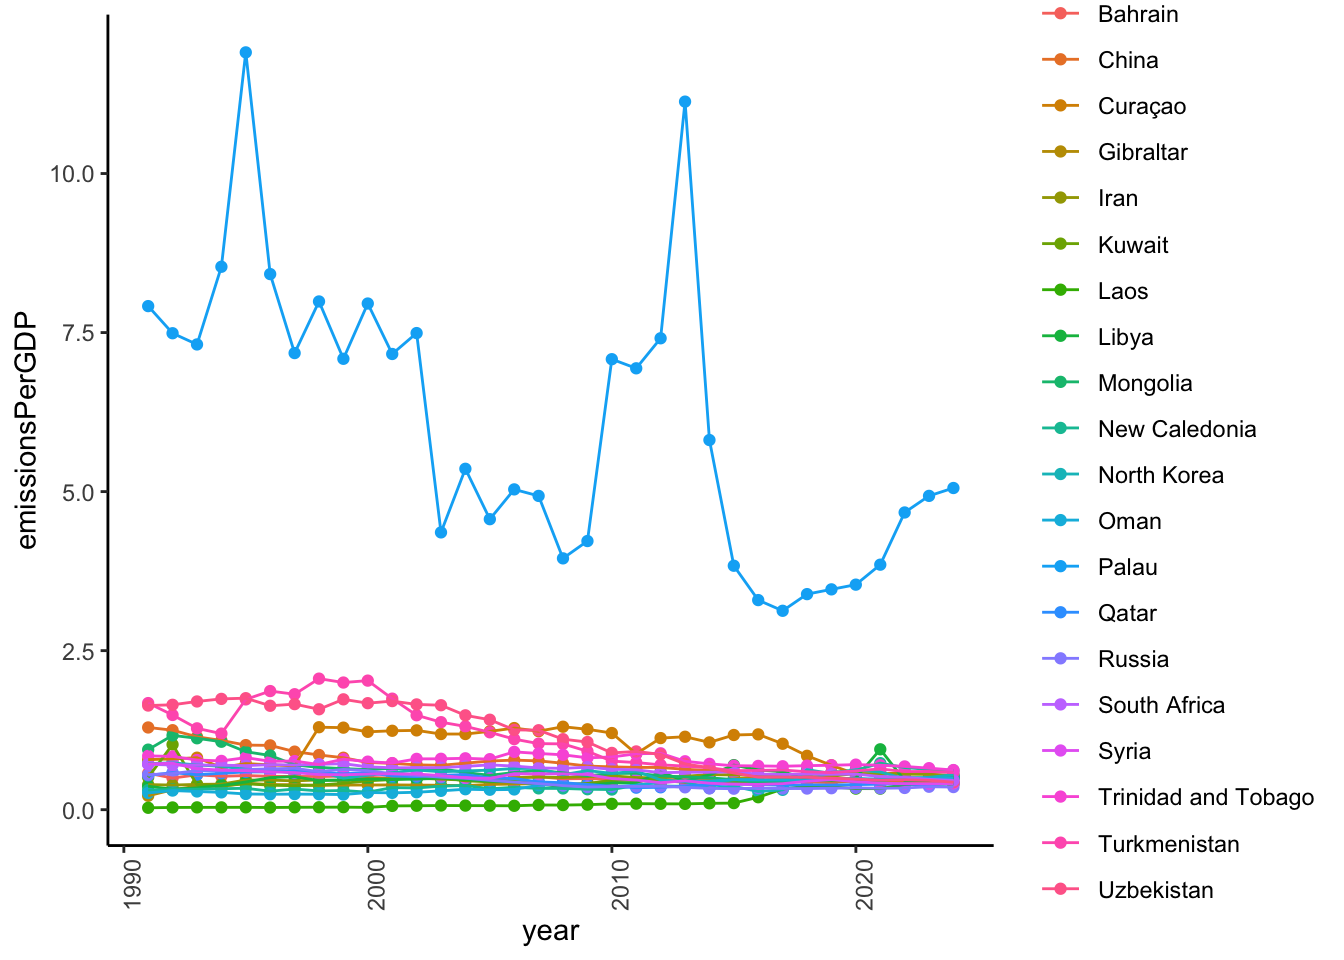
|> :: filter (Country %in% top_20_2023$ Country) |> :: ggplot () + aes (year, emissionsPerGDP, color = Country, group = Country) + geom_point () + geom_line () + theme_classic () + theme (axis.text.x = element_text (angle = 90 ))
Now, let’s see how the top 20 in 1970 have changed.
<- CO2_per_GDP_long |> :: filter (year == "1990-12-31" ) |> :: arrange (desc (emissionsPerGDP))<- top_1990[1 : 20 ,]<- top_20_1990$ Country|> :: select (Country, emissionsPerGDP) |> :: filter (! is.na (Country)) |> :: kable (format = 'html' ) |> :: kable_classic ()
Palau
7.9159665
Bosnia and Herzegovina
2.2571260
Turkmenistan
1.6756693
Uzbekistan
1.6371740
Estonia
1.3045817
China
1.2924157
Armenia
0.9531494
Mongolia
0.9437895
Kyrgyzstan
0.8837884
Kazakhstan
0.8607925
Trinidad and Tobago
0.8456379
Belarus
0.8380183
Curaçao
0.7873725
Poland
0.7477254
Azerbaijan
0.7370217
Serbia and Montenegro
0.7300506
North Korea
0.7248974
Syria
0.7192844
South Africa
0.7136041
Moldova
0.6718567
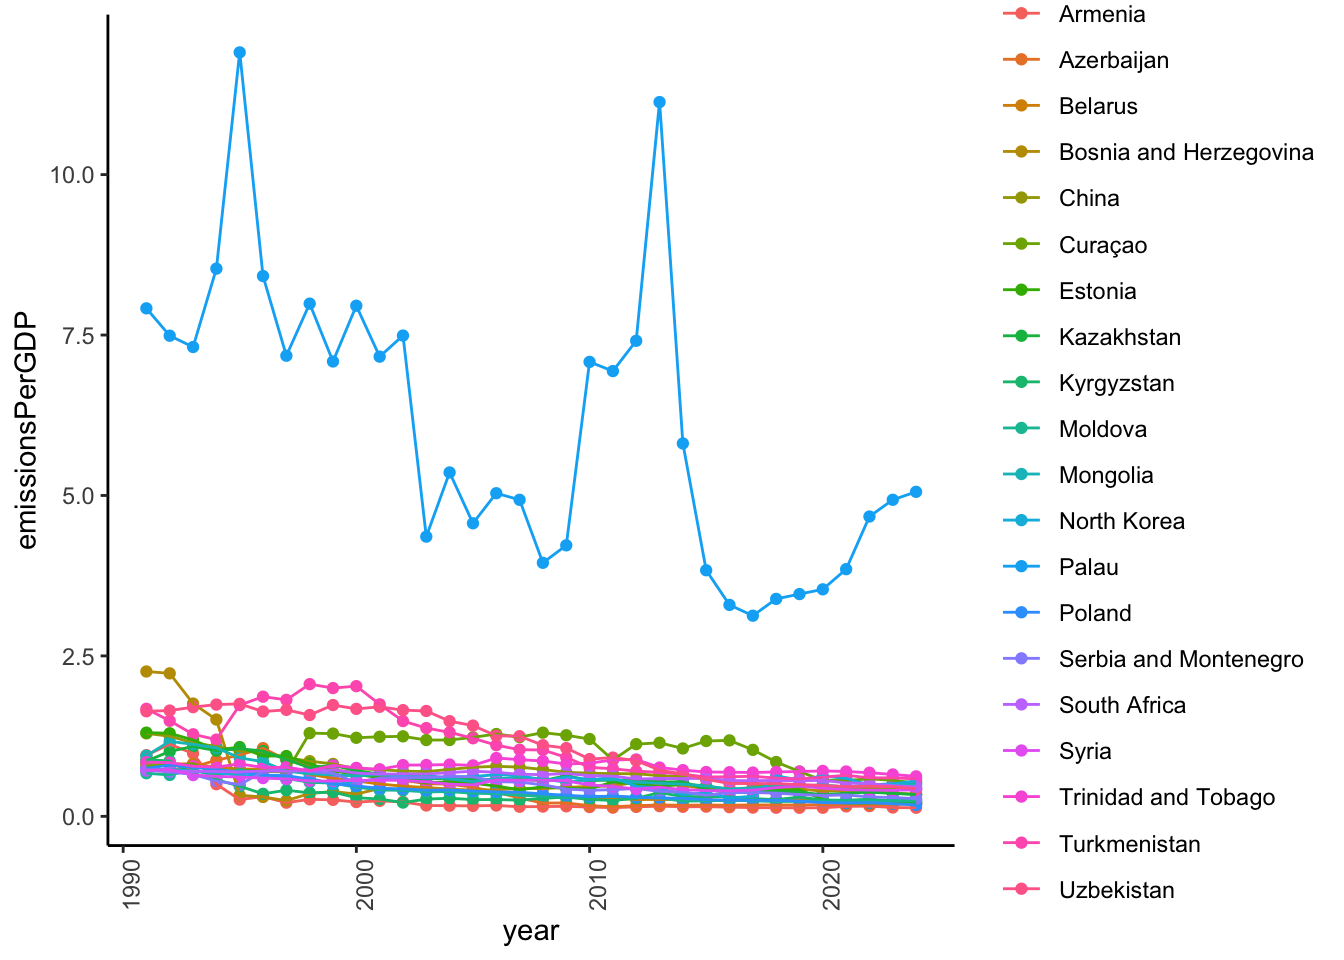
|> :: filter (Country %in% top_20_1990$ Country) |> :: ggplot () + aes (year, emissionsPerGDP, color = Country, group = Country) + geom_point () + geom_line () + theme_classic () + theme (axis.text.x = element_text (angle = 90 ))
So, the top emitters per GDP in 1990 have made progress in reducing emissions per GDP, even the outlier, Palau. Why is tiny Palau so inefficient? Wikipedia suggests that transportation is one answer, but provides no supporting information.
Just for fun, let’s see which countries are the most efficient.
<- CO2_per_GDP_long |> :: filter (year == "1990-12-31" ) |> :: arrange (emissionsPerGDP)<- bottom_1990[1 : 20 ,]<- bottom_20_1990$ Country|> :: select (Country, emissionsPerGDP) |> :: filter (! is.na (Country)) |> :: kable (format = 'html' ) |> :: kable_classic ()
Greenland
0.0005463
Timor-Leste
0.0010613
Anguilla
0.0224382
Mali
0.0235482
Turks and Caicos Islands
0.0252290
Burundi
0.0256910
Cambodia
0.0274837
Comoros
0.0293586
Dominica
0.0294329
Laos
0.0297871
Saint Lucia
0.0304574
Nepal
0.0308252
Chad
0.0317239
Burkina Faso
0.0322424
Benin
0.0340629
Saint Vincent and the Grenadines
0.0353187
Saint Kitts and Nevis
0.0357107
Central African Republic
0.0373606
Madagascar
0.0381227
Haiti
0.0421958
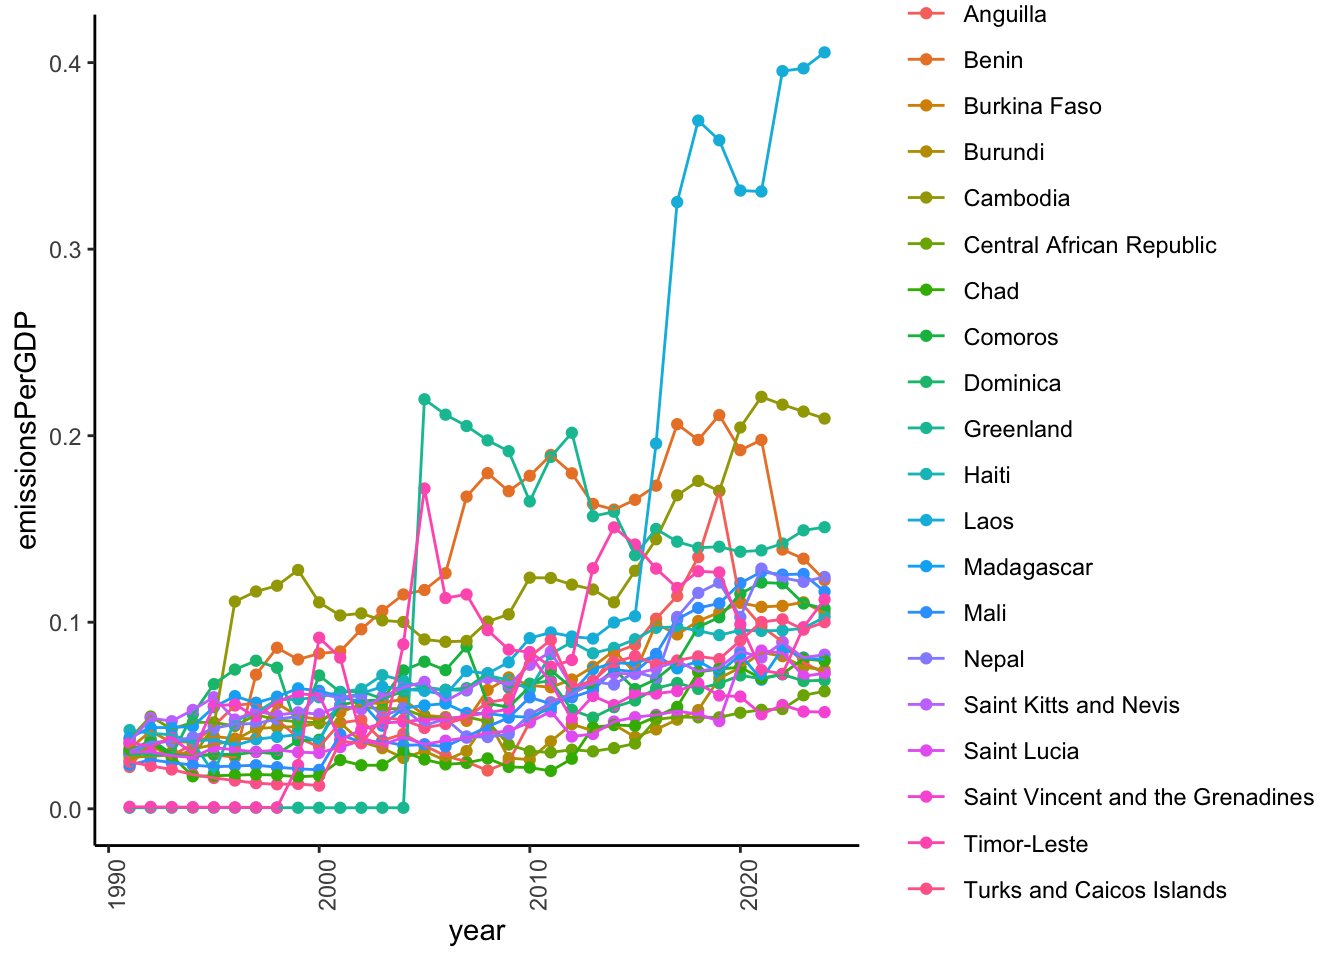
I see a number of tourism-heavy locations.
|> :: filter (Country %in% bottom_20_1990$ Country) |> :: ggplot () + aes (year, emissionsPerGDP, color = Country, group = Country) + geom_point () + geom_line () + theme_classic () + theme (axis.text.x = element_text (angle = 90 ))
So, emissions/GDP have increased from 1990-2023. Let’s look at some larger and wealthier countries.
|> :: filter (Country %in% c ("United States" ,"China" ,"Japan" ,"Germany" ,"France and Monaco" ,"Canada" ,"United Kingdom" ,"Taiwan" ,"South Korea" ,"Australia" |> :: ggplot () + aes (year, emissionsPerGDP, color = Country, group = Country) + geom_point () + geom_line () + theme_classic () + theme (axis.text.x = element_text (angle = 90 ))|> :: filter (Country %in% c ("United States" ,"China" ,"Japan" ,"Germany" ,"France and Monaco" ,"Canada" ,"United Kingdom" ,"Taiwan" ,"South Korea" ,"Australia" |> :: filter (year == "2023-12-31" ) |> :: arrange (emissionsPerGDP) |> :: select (Country, emissionsPerGDP) |> :: filter (! is.na (Country)) |> :: kable (format = 'html' ) |> :: kable_classic ()
France and Monaco
0.0750352
United Kingdom
0.0816601
Germany
0.1114582
Japan
0.1639868
Taiwan
0.1752721
United States
0.1898466
South Korea
0.2193066
Australia
0.2358940
Canada
0.2569113
China
0.4246254
So, China is catching up to the wealthier countries in emissions per GDP. France, the U.K., and Germany are especially efficient. The U.S. is in the middle of this group. Canada and Australia have room to improve.


