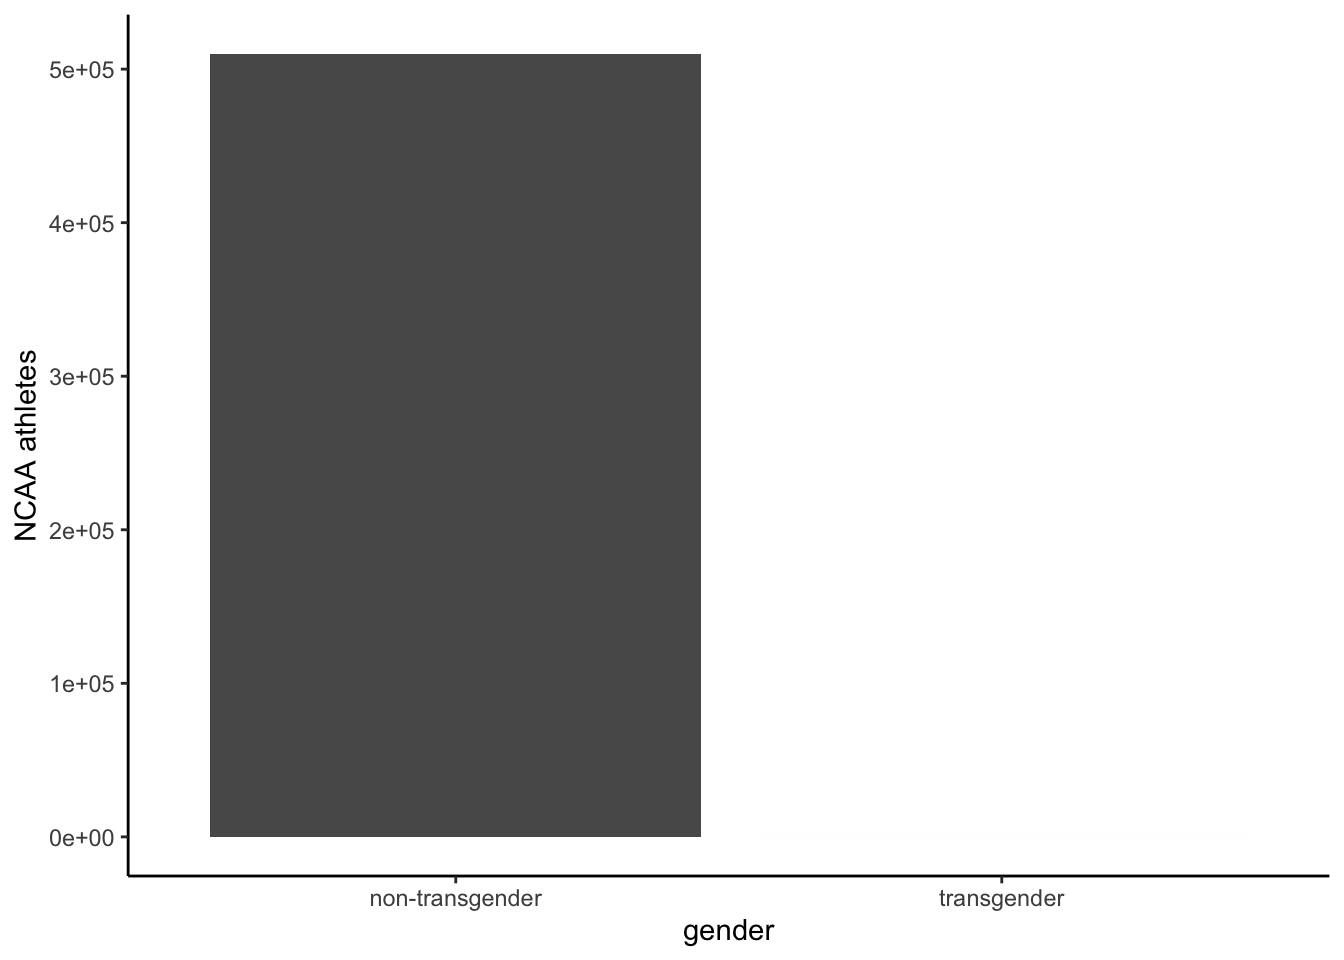
According to NCAA officials, there are fewer than 10 transgender athletes among more than 510,000 collegiate athletes in the U.S.
https://substack.com/@extremearturo/note/c-82077335?r=db7nz&utm_medium=ios&utm_source=notes-share-action
I just don’t believe people who think that banning transgender athletes from competition has anything very much to do with fairness in sport.
In the spirit of my Spring 2025 class on data visualization, here is a simple visualization of these data.
suppressPackageStartupMessages(library(ggplot2))

gender <- data.frame(gender = c("non-transgender", "transgender"), athletes = c(510000, 10))

gender |>
  ggplot() +
  aes(x = gender, y = athletes) +
  geom_col() +
  ylab("NCAA athletes") +
  theme_classic()
It’s hard to see a tiny stand of trees amidst a vast forest, isn’t it?
