I’ve taken on the task of creating workflows for the PLAY Project survey data that is collected using KoBoToolbox. On a roughly weekly basis, I download the survey data and run it through a data processing pipeline with two main goals:
Have data in a working form most of the time.
Generate useful visualizations and summaries of the data that help us manage the project.
You can see the full workflow here as a site rendered using the bookdown package here: https://play-behaviorome.github.io/KoBoToolbox/
I’m a big fan of bookdown, but I may need to consider migrating this site to Quarto at some point.
As with most “works-in-progress” there are many things yet-to-do, and the code clearly shows how my knowledge and thinking have evolved over several years. But working on this project has reinforced the idea that “plotting early and often” or even “plotting first” is a worthwhile goal. If you can generate a meaningful plot for some piece of data, then it’s in a useful form. That’s the idea.
Here’s an example:
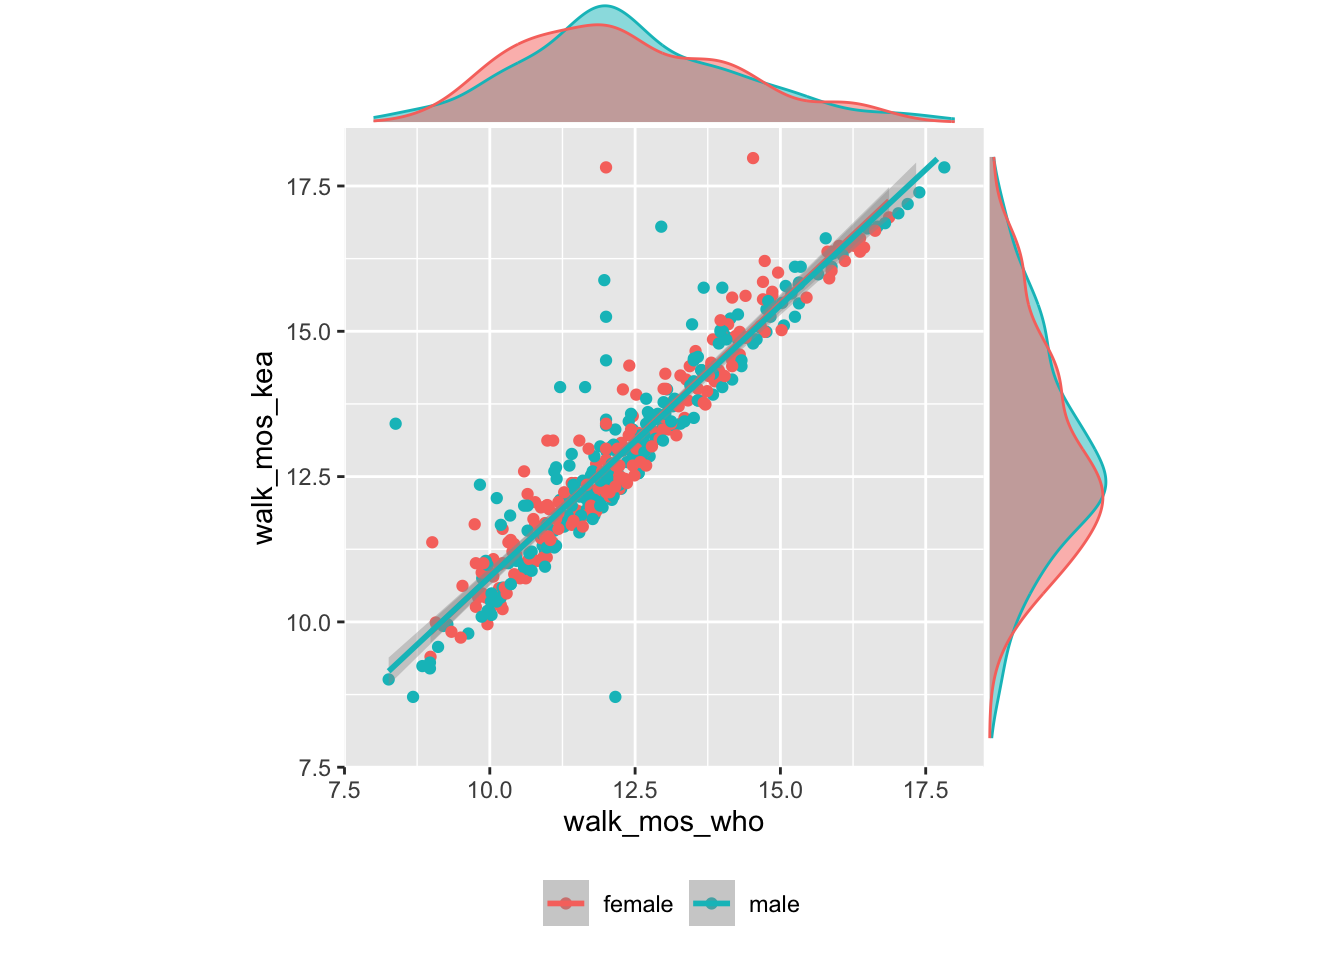
It shows the relationship between a set of criteria used by the World Health Organization (WHO) to determine when a child begins walking and a stricter set of criteria used by my colleague Karen Adolph in her research on locomotion. You’d hope that these relate to one another closely, and this plot shows that’s the case. It also shows that there aren’t clear sex differences. That might have been known before, but if so, our data bolster the finding.
Here’s another plot I created today based on the Early Childhood Behavior Questionnaire (ECBQ) very short form:
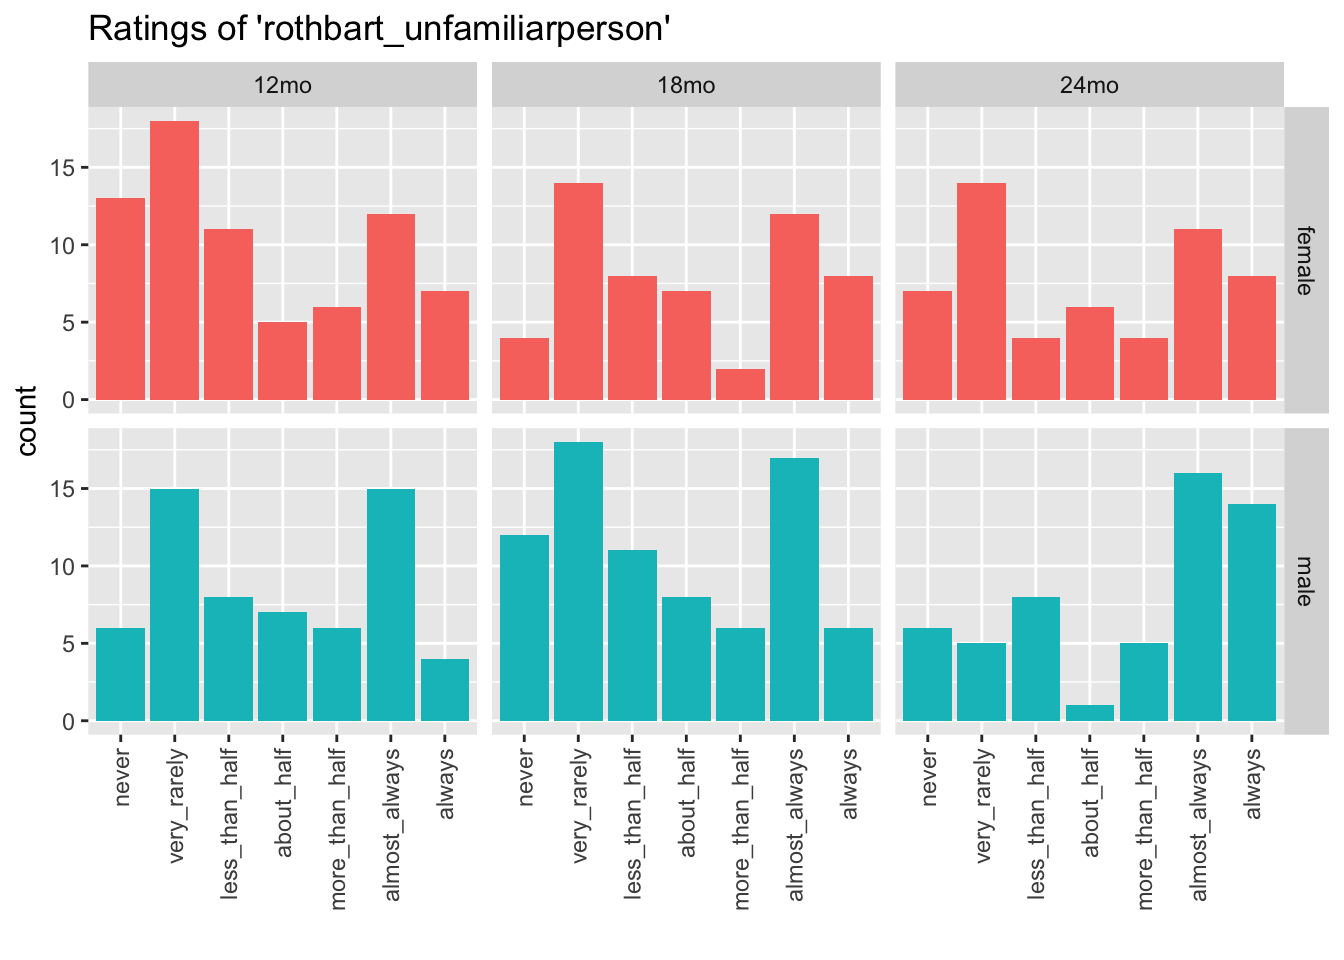
Clearly, I need to do more work on the data dictionary so I can pull in the question parents were actually asked. But it’s satisfying to get this far, especially since not all of the figures look the same:
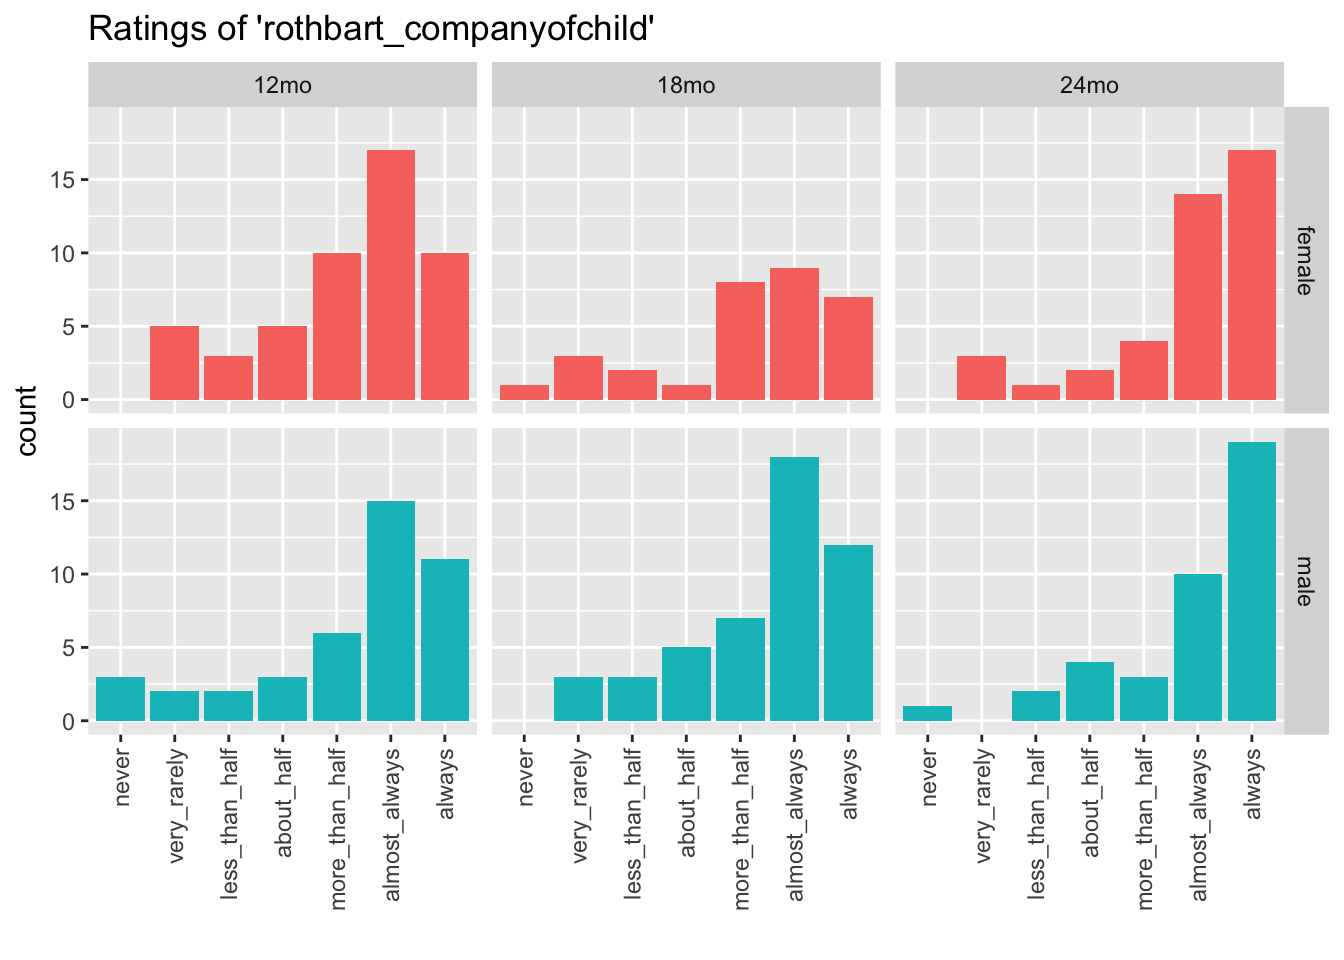
Moreover, I believe that standard practice when using this measure is to calculate aggregate “scale” scores without visualizing the individual responses. We’ll get to aggregate scales soon, but these individual scores are interesting in their own right.