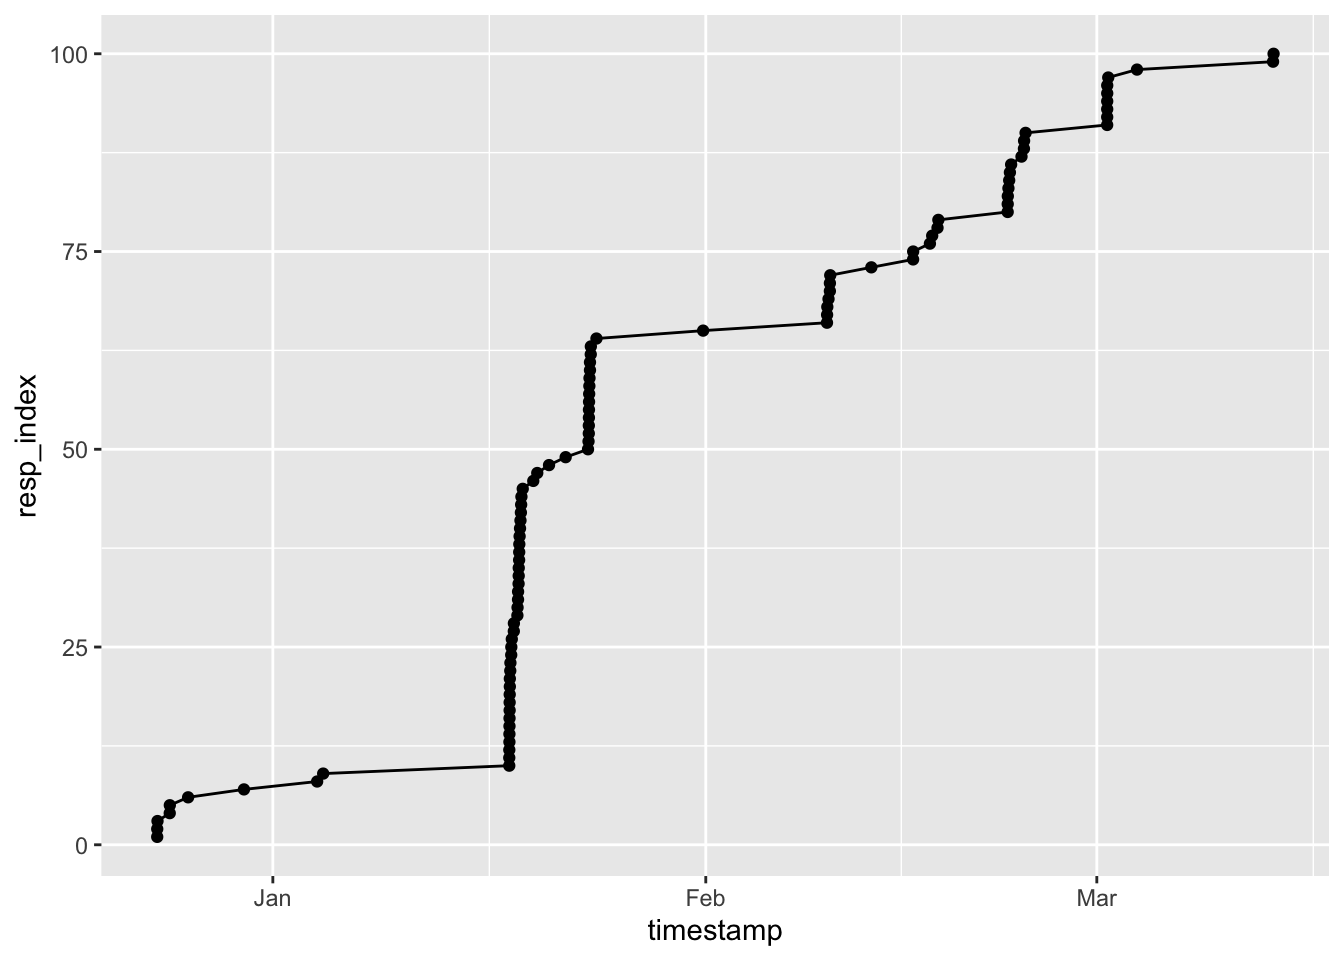
One of the first formal activities of our very informal open science working group has been a survey on open science knowledge and practices.
It seemed right to walk the walk if we were going to talk the talk. So, I took the survey project as an opportunity to explore how a powerful R package called bookdown could help make the process more transparent and reproducible. The github repository is here: https://github.com/penn-state-open-science/survey-fall-2022, but a more visually attractive introduction can be found in the rendered site: https://penn-state-open-science.github.io/survey-fall-2022/index.html and especially the data visualizations https://penn-state-open-science.github.io/survey-fall-2022/data-visualization.html.

The site is somewhat unique in capturing the information we filed with the Penn State IRB prior to conducting the study. Also novel is that the site incorporates code that downloads and cleans the survey data and goes on to show some simple visualizations of it. So, the process of updating the report as new responses come in is extremely simple.
There are still tweaks to be made. For one thing, we did not control the department or unit that respondents could report. So, there is some manual cleaning to do when a respondent uses an idiosyncratic name for their unit. Also, I’m still trying out different ways to authenticate to Google–the survey is a Google Form.
But all-in-all, the site not only shares important details about our project that are often left unshared, but the site is a living document about the state of our research. It may not be the intended use of the bookdown package, nor make the most interesting reading, but it serves exactly the purpose we sought to achieve with the survey and hope to achieve with our incipient center.